
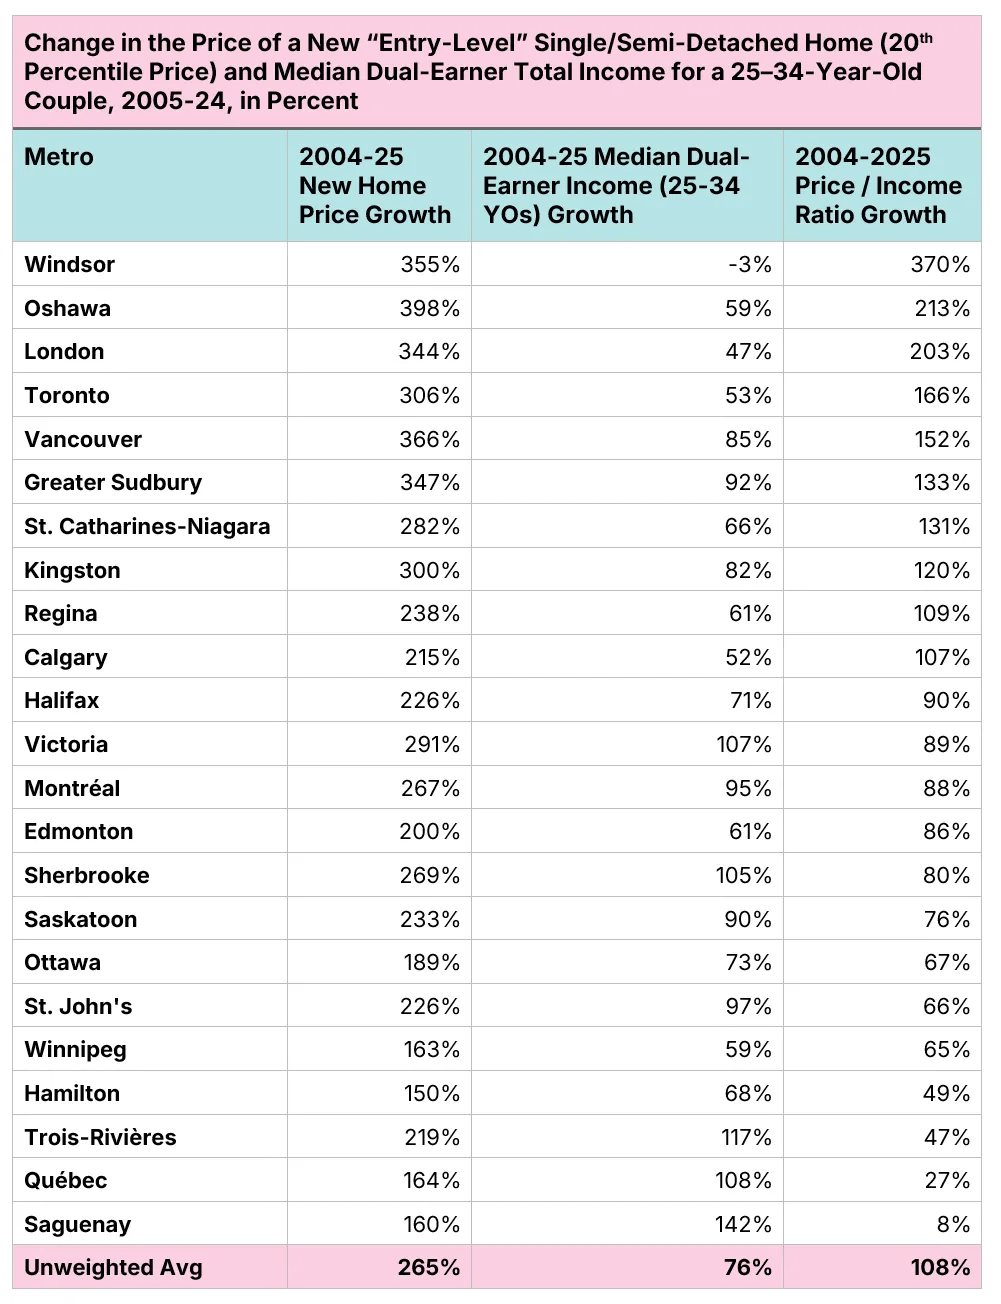
Incomes rose 76%. New starter-home prices rose 265%.
Highlights
- Starter homes have detached from middle-class incomes: Across 23 Canadian metros, newly built family-sized starter homes are now over twice as expensive relative to income as they were in 2004.
- Prices soared while incomes lagged: Since 2004, new-home prices at the lower end of the market have risen by 265% on average, while young dual-earner incomes grew just 76%.
- Affordability erosion is nationwide: Markets like London, Kingston, and St. Catharines-Niagara are now less affordable for starter homes than Vancouver was in 2004.
- Time won’t fix this on its own: Even if new-home prices stopped rising entirely, it would take the average metro 16 years to reach a 4-to-1 price-to-income ratio and roughly 25 years to restore 2004 affordability.
- Fixing affordability requires lowering building costs: Without serious action on taxes, infrastructure funding, land use, and building regulations, middle-class families will remain priced out of newly built starter homes for decades.
Across Canada, new starter homes are over twice as expensive, relative to income, relative to 2004
Brand-new family-sized starter homes are over twice as expensive relative to income as they were 20 years ago. And unless governments get serious about bringing down the cost of homebuilding, it will take another 20 years to fix.
My favourite example of how much more affordable housing was in the past is the house my wife and I bought when we were in our late 20s. It was a two-storey, three-bedroom, 1,250-square-foot single-detached home in London, Ontario, priced at $168,000.
This was not an unusual price at the time. The CMHC’s Housing Market Information Portal shows that in the London-area in 2004, the median newly constructed single-detached or semi-detached home was selling for $220,000, and homes priced at the 20th percentile were selling for $180,000. Our home was at the lower end of the price range, making it a perfect place to raise a family.
Figure 2: CMHC housing absorption data for London CMA, 1998-2004
Unfortunately, the CMHC data set only has data for single and semi-detached for this era (and semi-detached homes are rare in London), so we cannot examine other housing forms. Since the home in my example is a semi-detached, it works for our purposes, but it is a limitation.
According to Statistics Canada data from tax filings, the median income for a dual-income couple between the ages of 25 and 34 in London, Ontario, in 2004 was $62,600, so a home a new single/semi-detached home at the 20th percentile, as well as the home we purchased, would have a price less than three times the median income for a young dual-income couple.
This was not unusual. From our home price and income datasets, we have 2004-era data for 23 metro areas. Only three of those 23 metro areas, Vancouver, Victoria, and Toronto, had price-to-income ratios above 4, and none had a ratio above 7, as shown in Figure 3.
Figure 3: Price to income ratios by metro area, 2004
Now let’s fast-forward to 2025. Statistics Canada’s income data only extends to 2023, but we can use it to estimate the median income for our young dual-earner couple. Across Canada, the couple’s incomes have been rising by an average of 2.6% per year. We can estimate the income level for 2025 by assuming 3% growth from 2023 to 2024, and an additional 3% from 2024 to 2025.
Today, 18 of 23 communities have a starter home price-to-income ratio above 4 (up from 3 in 2024), and 8 have a ratio above 6.8, the highest in 2004 (Vancouver).
Consider that for a moment. Housing in London, St. Catharines-Niagara, and Kingston is more expensive for middle-class families today than it was in Vancouver in 2004.
Figure 4: Price to income ratios by metro area, 2025
Outside of Windsor, whose numbers should be taken with a grain of salt, the issue is not that nominal incomes have been flat. In fact, nominal incomes for our young, dual-earner income couple are up 82% since 2004. The issue is that newly constructed home prices at the 20th percentile have increased by more than 300% in many markets. The average market in our sample of 23 metros saw new-home prices rise by 265% from 2004 to 2025, while nominal incomes rose by only 76%.
Figure 5: Growth in home prices, incomes, and price-to-income ratios, 2004 to 2025
There will be a temptation to write all of this off as a function of pandemic-era ultra-low interest rates and the population growth that soon followed. While the pricing dynamics differ by markets, the pre-pandemic experience in London shows that affordability challenges predate the pandemic. Price-to-income ratios more than doubled between 2004 and 2019, with much of that growth occuring between 2016 and 2019.
This raises an obvious question: “Is it possible for newly-constructed family-sized starter homes to become affordable again without prices going down?” One way to examine this question is to consider the scenario in which new home prices remain flat while incomes continue to rise at 3% per year.
If our goal is to return to a price-to-income ratio of three (which is still higher than what I experienced in London, ON, in 2004), only Sherbrooke and St. John’s would reach that level in the next decade (with three other metros already there), and the average metro would need 25 years (excluding the ones already there).
If our goal is a more modest 4-to-1, the average drops to 15.9. That means today’s 30-year-old dual earner couple would need to wait until they’re 46 for homes to become attainable by that measure.
Figure 8: Time needed to reach price-to-income thresholds by metro
Of course, that is a one-size-fits-all measure. Perhaps a better question is, “How long would it take to return to 2004-levels of affordability, assuming prices stay flat?”
For Saguenay, it would only take a couple of years, and Quebec City would get there within a decade. For the average metro, it would take almost 25 years. For my hometown of London, ON, it would take over 37.
A 29-year-old version of me today would have to wait until he was 66 and likely retired to have the same level of housing attainability I had back in 2004. And that’s assuming we can somehow keep new home prices stable for nearly four decades.
Figure 9: Time needed to reach 2004 levels of affordability by metro
The middle class will not be able to afford a family-sized starter home, as I did in 2004, unless they get serious about reducing the cost of homebuilding. That includes reforming taxes, such as land-transfer taxes and the GST. It includes reforming the way we build and fund infrastructure. It requires grown-up conversations about urban expansions and infill zoning reform to reduce the per-unit cost of land. We need to examine the building code to identify areas where homes are unnecessarily expensive, and to open up new housing types, as the starter home of 2034 may have to be different from that of 2004. And it requires ensuring that our housing policies and immigration policies are aligned.
Unfortunately, to date, our governments have shown a distinct lack of seriousness about middle-class housing affordability. That needs to change.
Posted by IHateTrains123
1 Comment
imo we need a government that is hostile to housing prices and whose goal is to make the real estate market crash
the housing ministers goal should be to make real estate so toxic for investors (note, im not saying housing development) that a 1 bedroom condo in downtown toronto goes for 100k max.