
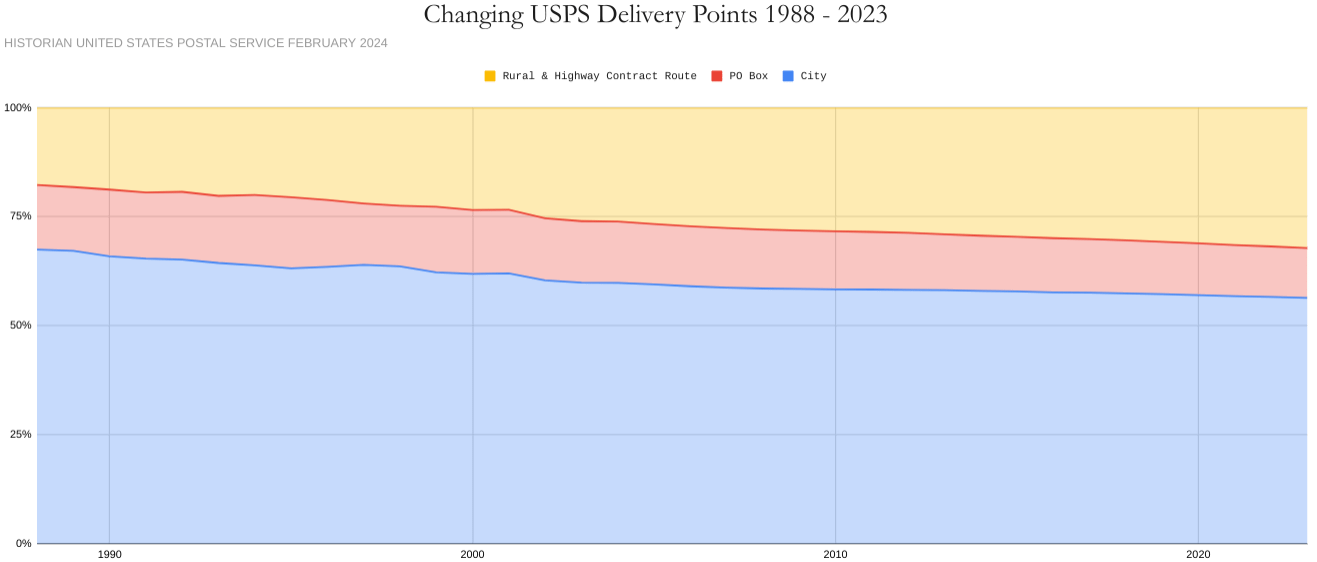
It’s not that people don’t want you to live in their backyard, they don’t want to even live in the city with you
Posted by semideclared
It’s not that people don’t want you to live in their backyard, they don’t want to even live in the city with you
Posted by semideclared
3 Comments
We provide our services through 31,000 Post Offices, stations, and branches that are managed by the Postal
Service, with Mail deliveries are made to nearly 169 million city, rural and highway, and PO Box delivery points in 2023.
Annual Change From a Year ago
Year |City | PO Box | Rural & Highway Contract Route | Total Delivery Points
—–|—–|—–|——–|–|
1989| 1.17% | 0.00% | 4.43% | 1.57%
1990| -1.28% | 5.29% | 3.77% | 0.60%
1991| 1.82% | 1.68% | 6.36% | 2.65%
1992| 0.51% | 3.30% | 0.00% | 1.42%
1993| 0.76% | 1.06% | 6.84% | 1.40%
1994| 0.63% | 6.32% | 0.40% | 1.46%
1995| 0.88% | 2.97% | 4.78% | 2.00%
1996| 0.50% | -5.77% | 3.04% | 0.00%
1997| 0.74% | -8.16% | 3.69% | 0.00%
1998| 0.61% | 0.00% | 3.56% | 1.17%
1999| 0.61% | 11.11% | 3.78% | 2.78%
2000| 0.60% | -1.50% | 4.64% | 1.20%
2001| 0.60% | 0.00% | 0.00% | 0.37%
2002| 0.60% | 0.51% | 12.03% | 3.26%
2003| 0.48% | 0.51% | 3.95% | 1.36%
2004| 0.59% | 0.50% | 1.09% | 0.71%
2005| 0.82% | 0.00% | 3.49% | 1.41%
2006| 0.58% | 0.50% | 3.38% | 1.32%
2007| 0.70% | 0.50% | 2.76% | 1.23%
2008| 0.46% | 0.00% | 1.96% | 0.81%
2009| 0.46% | -0.50% | 1.44% | 0.60%
2010| 0.34% | 0.00% | 1.18% | 0.53%
2011| 0.34% | -0.50% | 0.93% | 0.40%
2012| 0.34% | -0.50% | 1.16% | 0.40%
2013| 0.34% | -1.51% | 1.60% | 0.53%
2014| 0.34% | -0.51% | 1.80% | 0.65%
2015| 0.56% | -0.51% | 1.55% | 0.71%
2016| 0.45% | 0.00% | 1.96% | 0.71%
2017| 0.44% | -0.52% | 1.28% | 0.77%
2018| 0.55% | 0.00% | 1.90% | 0.83%
2019| 0.55% | -0.52% | 1.86% | 0.82%
2020| 0.55% | 0.00% | 2.03% | 0.94%
2021| 0.65% | -0.52% | 2.39% | 1.05%
2022| 0.76% | 0.00% | 2.14% | 1.10%
2023| 0.64% | -0.52% | 2.29% | 1.03%
Interesting though I wonder how much of this is just explained by online commerce.
UPS, Amazon, FedEx etc. rather infamously outsource a lot of rural deliveries to USPS. If more people are ordering stuff from Amazon this wouldn’t really affect city deliveries much at all (Amazon’s own trucks are making those) but would spike rural deliveries (it’s not profitable for Amazon to deliver stuff to central nowhere Nebraska so they just make USPS do it.)
It is mostly specifically illegal to add housing to cities. The outcomes of that policy aren’t inherently “what people want”.