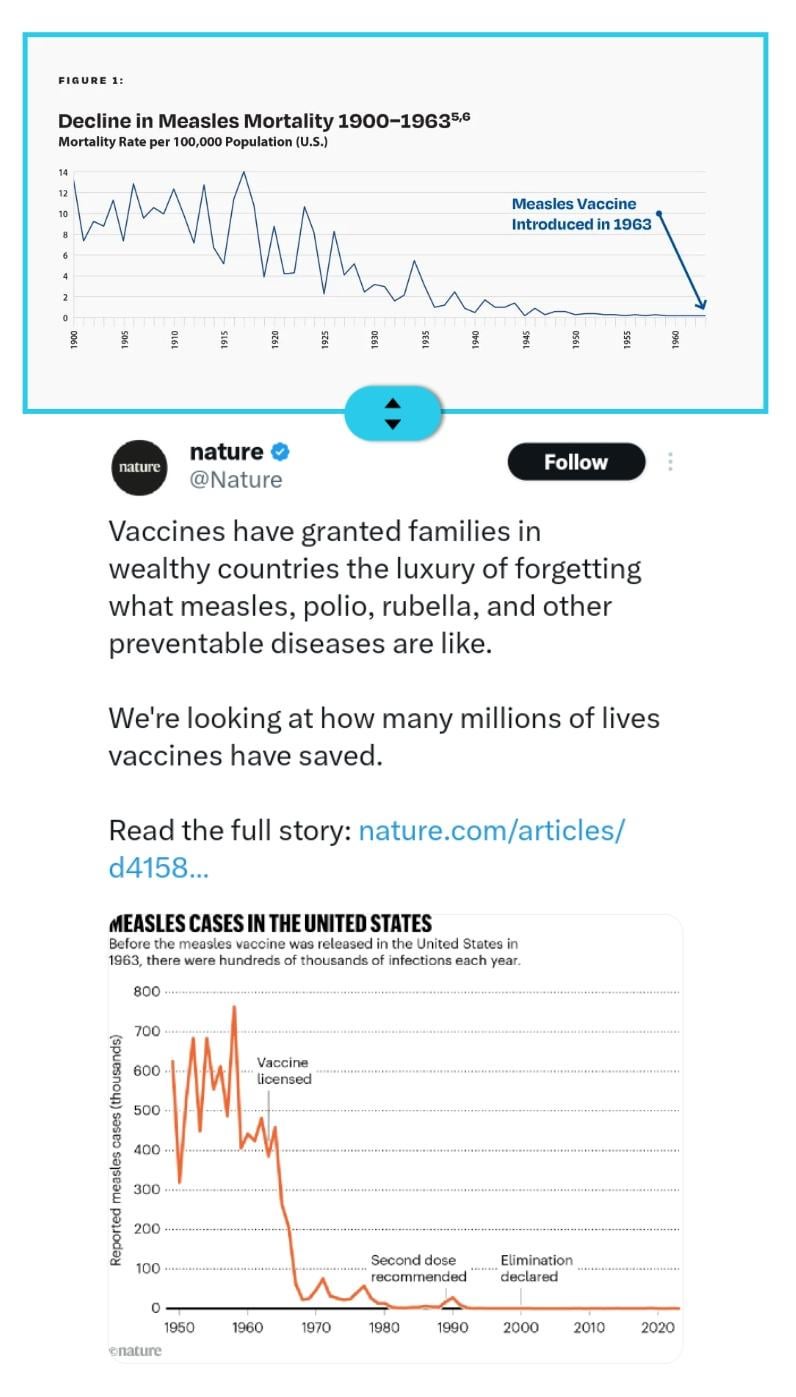
Nature turns off Comments. Guess it doesn’t want anyone posting the whole history
Posted by UniversalSurvivalist

Nature turns off Comments. Guess it doesn’t want anyone posting the whole history
Posted by UniversalSurvivalist
2 Comments
SS: Nature turns off Comments.
Guess it doesn’t want anyone posting the whole history
Source:
https://x.com/Nature/status/1909545703128391978?t=_GaG3HhAbodX2tSH-pglXA&s=19
These graphs aren’t contradictory and can both be true. Measles deaths could have gone down prior to the vaccine due to better medical treatment for the condition, and then total number of cases could have gone down once the vaccine was introduced and prevented people from getting it in the first place.
Now I haven’t actually researched either of these to verify that either graph is actually accurate, just offering an explanation of how both can be true at the same time.