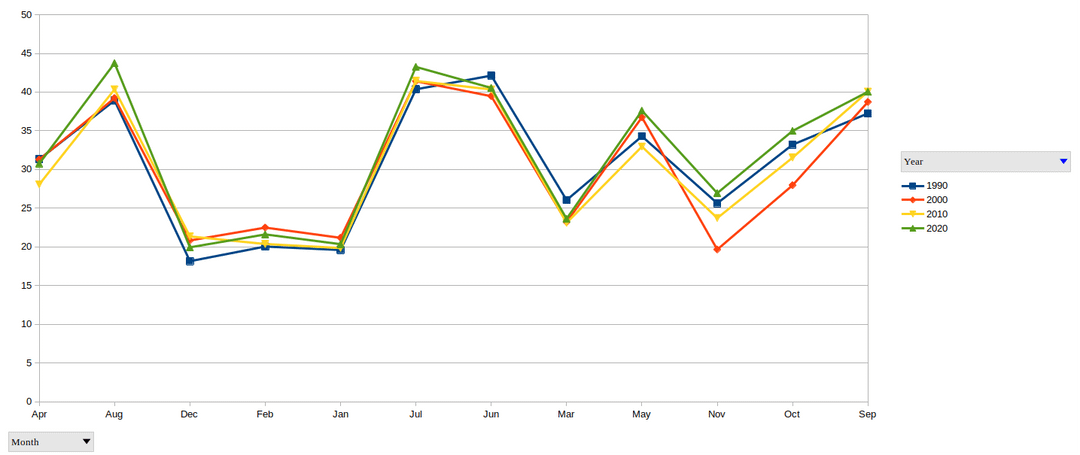
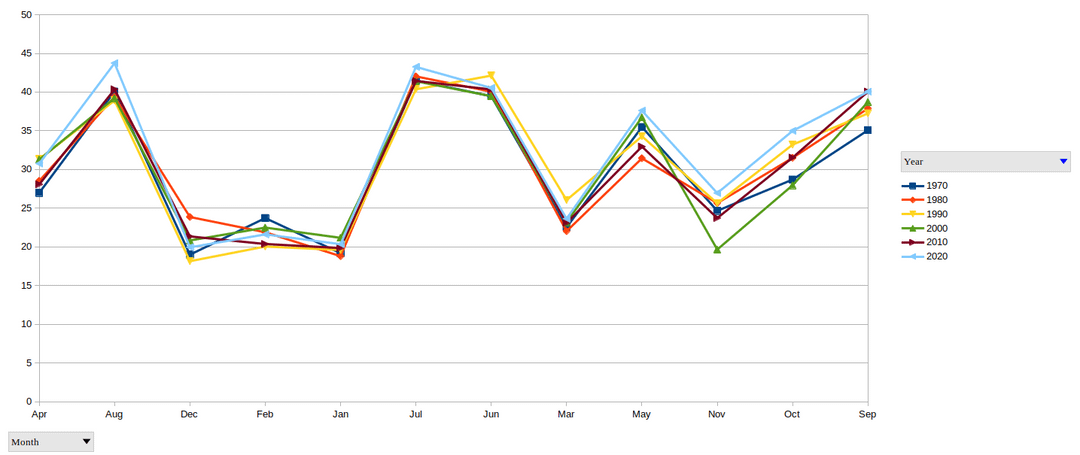
If I could think of one word for the temperature differences, it would be “inconclusive”
Posted by DerpyMistake

If I could think of one word for the temperature differences, it would be “inconclusive”
Posted by DerpyMistake
5 Comments
I made these charts from the raw data for Phoenix.
The data is out there, so why do we blindly accept the word of “experts”?
[https://www.ncdc.noaa.gov/cdo-web/datatools](https://www.ncdc.noaa.gov/cdo-web/datatools)
if anyone is curious, I used a script to pull the data:
curl -O https://www1.ncdc.noaa.gov/pub/data/ghcn/daily/ghcnd-stations.txt
grep -i “Phoenix AP” ghcnd-stations.txt
wget https://www.ncei.noaa.gov/pub/data/ghcn/daily/all/USW00023183.dly
Very, (imo anyway), misleading graph. Seems to be intentionally made to appear as though there hasn’t been much difference. Just my read on it.
You didn’t even label the y axis?? What are you plotting? And if it’s average monthly temperatures, be for real about your data and include error bars.
“Climate change isn’t real because it’s only got a couple degrees warmer”
1) a couple degrees is actually a lot
2) climate change is so much more than just a raise in temperature (there’s a reason we stopped calling it global warming)
Cool, now zoom out for the whole world and go back a hundred years.
[Here](https://www.ncei.noaa.gov/access/monitoring/climate-at-a-glance/global/time-series/globe/tavg/land_ocean/12/3/1850-2025)