
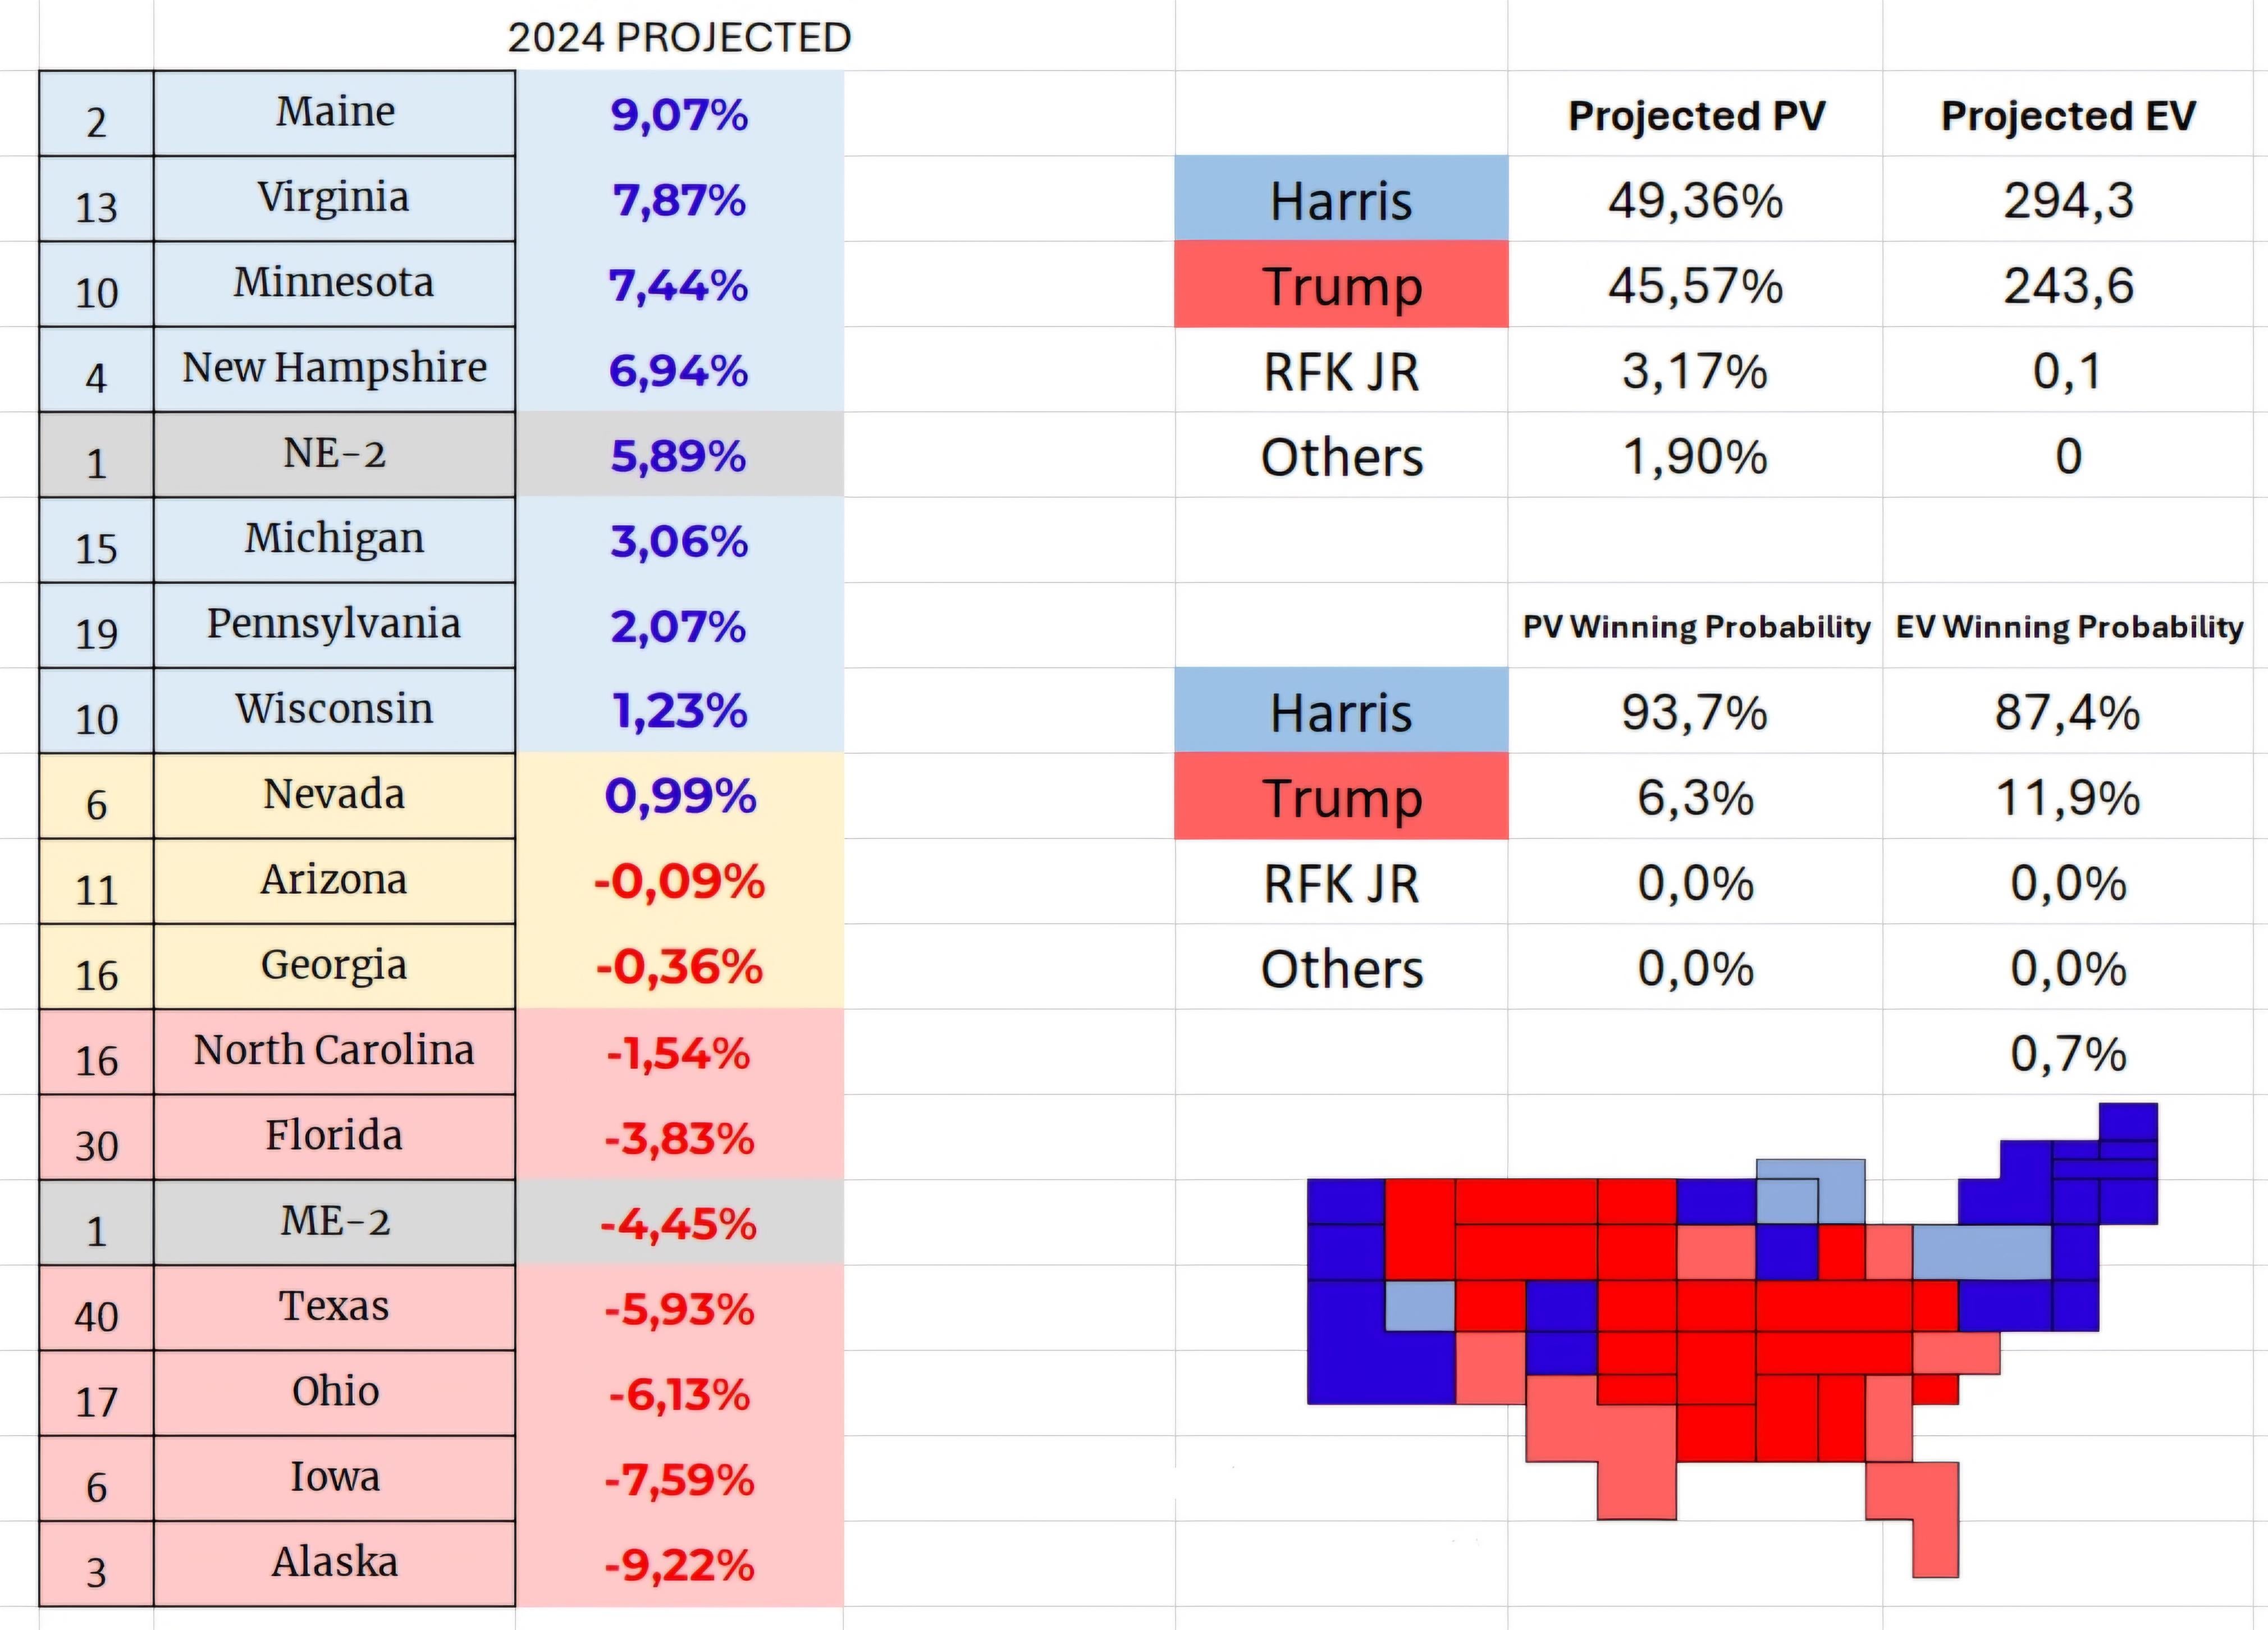
-Historical Partisanship changes
-Trends
-B or above rated national and state polls
-State and National results' historical balance
Historical partisanship data contains a lot of Senate, statewide House and gubernatorial elections. The weight on these data is mostly from 2018 to 2022.
Trends: "2016 to 2020", "1992 to 2020", 2018 to 2022"- Overall state changes in partisanship, partisanship trends.
B or above rated polls – This is a simple weighted and normal average.
State and National results' balance – This one is my favorite. This balance accounts for the presidential election results' balance between state and national since 1992. To put this into perspective, you would always expect some states to be higher than the national results.
This balance is applied to the states' polls weighted average into the national result.
Then, I apply the national polls' result into states' results, so in the end, my forecast model works like an orchestra.
Posted by ctolgasahin67
6 Comments
Trump at 11.9% seems way low
Really hard to call AZ a 50/50 state atm. Have to believe that it’s still favored for Trump right now based on polling data.
Really hard to call AZ a 50/50 state atm. Have to believe that it’s still favored for Trump right now based on polling data.
I was wondering if your model can offer more modular predictions. For example, maybe I’m a non-believer in the historic trends stuff you’re adding to the predictions – can I possibly set its weight to 0 and recalculate the predictions?
How is PA blue? The RCP average has Trump leading by 2%.
Indiana is now tilt blue in mine