
TLDR:
Median age is rising 59% faster, workforce shrinking up to 44% faster, and the 2025 to 2040 crunch is locked in by demographic momentum. Thank you one child policy.
This sub loves a bit of demographic doomposting and every time it comes up someone inevitably brings up the Japan comparison. Usually lazy analysis along the lines of “China is just following Japan’s Path, they’ll be fine”. (Not that 3 lost decades of near zero growth and >400% non-financial debt to GDP is doing “fine” but anyway).
The problem is nobody actually quantifies how much faster this is happening. Most of the charts and analysis floating around are a few years old. So I pulled the latest UN World Population Prospects (2024) dataset and crunched the numbers myself.
I focused on two metrics that matter most economically:
-Working-Age Population (15–64)
-Median Age (how fast the population is getting older)
How much faster is China ageing?
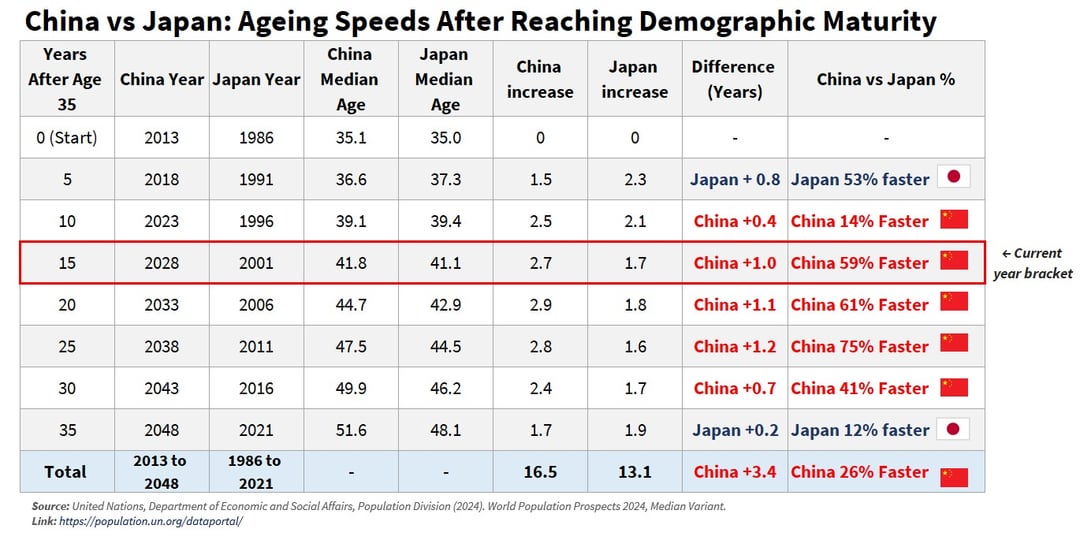
Between 2023 and 2028, China’s median age goes up by 2.7 years, from 39.1 to 41.8. When Japan moved through that same age range (10-15 years post demographic maturity) it only aged 1.7 years. China’s median age is rising 59% faster in this window.
How much faster is working age population shrinking?
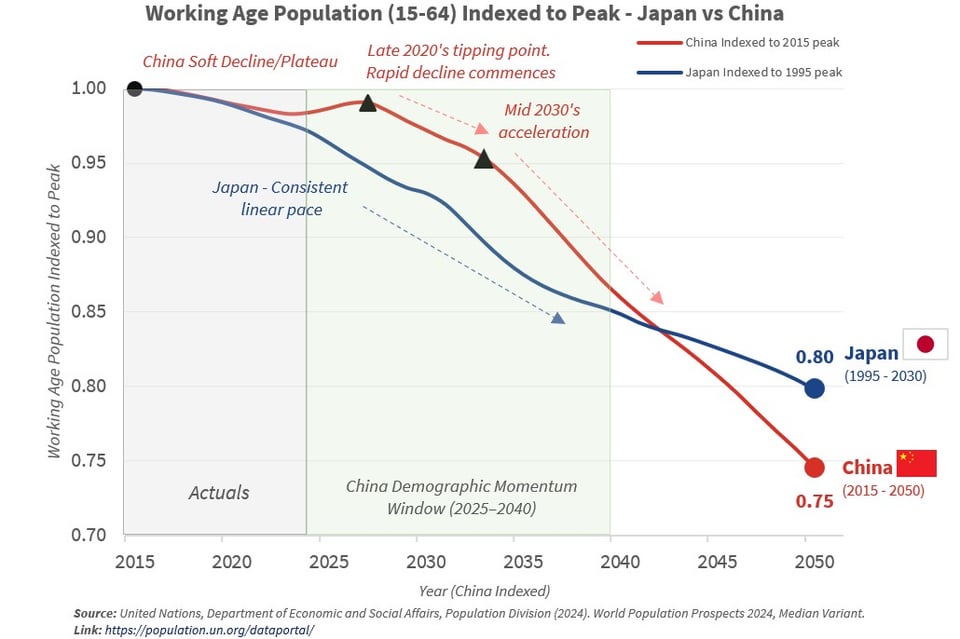
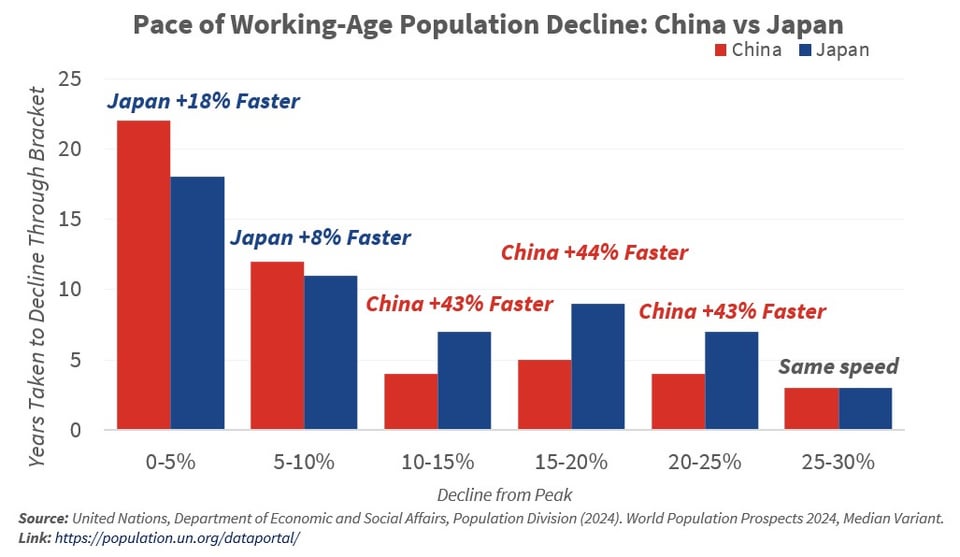
Japan acutally moves faster through the first 10 percent of decline while China more or less flatlines after its 2015 peak. That flips in the late 2020s when China’s working-age population starts to drop hard then accelerates further in the mid 2030s. By the early 2040s China squeezes about 25 years of Japan’s decline into 10-15 years. During this stage China’s working age population will be declining roughly 44% faster.
The 2025 to 2040 period is effectively locked in due to demographic momentum. Everyone who will be of working age in that window is already born. No policy or fertility change today can stop it.
Methodology
Median age indexed from when each country hit age 35 (China 2013, Japan 1986) and working-age population is indexed to each country’s peak (China 2015, Japan 1995). Data is pulled straight from UN data portal, median variant.
The gap comes down to fertility. China’s birth rate fell harder and faster than Japan’s and occured about 20 years later. That shift sets China up for a much steeper drop, where Japan’s decline across both metrics was slower and roughly linear.
All analysis, charts and tables made by me using Excel. Happy to share CSVs or walk through the method if anyone wants to build on it.
Posted by Mido_Aus
1 Comment
https://preview.redd.it/3ygtnsw83fcf1.png?width=1469&format=png&auto=webp&s=dc3e45dc8f97c2c883ee5196b31c7a2a4e55f61d
For anyone who wants to dig into the data themselves, here are the parameters for the data portal.
[https://population.un.org/dataportal/](https://population.un.org/dataportal/)